EMIS
Despite limited resources, school systems in developing nations are often asked to increase the quality and quantity of basic education. Achieving quality education requires careful system management, planning, evaluation, and above all, good information. Often, however, good data do not exist, and where information is available, there may be limited incentive or ability to use it. Therefore, many education ministries fail to use information to guide their decision making.
Developed with USAID-funding, RTI International designed the Education Management Information System (EMIS) Toolbox to give government education planners the tools needed to analyze performance data in accessible and easily interpreted ways, e.g. via charts, maps, or sorted lists.
KEY FEATURES
The EMIS Toolbox allows various levels of government to make evidence-based education decisions and helps to increase transparency by sharing performance data with key stakeholders and decision-makers.
EMIS quickly maps to annual school census databases and to multiple data sources. Data can be presented showing administrative or other boundaries. The system can be modified to support different languages. EMIS also runs on a PC as a stand-alone installation or from a server connected via a network or the Internet; installs locally from .exe file and CD Rom.
HOW IT WORKS
The EMIS Toolbox is an open source, data-mining tool that aggregates and presents data from Annual School Census (ASC) databases that was specifically designed to visually identify trends and outliers. Complex data can be easily viewed and analyzed through charts that compare indicators by geographic or administrative group and over time; via lists ordered by indicator; or even using standard reports, for example using school or district indicators such as enrollment rates.
The versatility of the EMIS Toolbox allows the user to choose from several different visual options, customizing data to best fit an audience. Trends often obscured in number crunching, such as the region with the poorest pupil enrollment rate or the school with the highest teacher absenteeism rate, become clearer for officials who can then enact more effective policies and resource allocations.
The EMIS Toolbox has four major sections: Analysis, Indicators, Reports and Manage Data.The first section of the EMIS Toolbox uses the education data to make charts:
Using Charts
Users are able to analyze the education data by making charts using education indicators, e.g. school numbers, enrollment rates, or the provision of water to schools. An advanced application also allows you to split the chart into further groups, such as the enrollment figures into boys and girls or by academic year.

Caption: Chart showing pupil-to-teacher ratio in schools in Sokoto state, Nigeria, by local government area.
Using Priority List
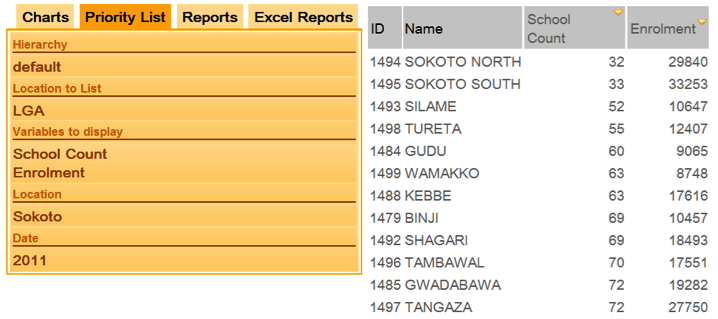
This function allows the user to sort the schools in the database numerically. For example, a user can run a report to list all schools in order from highest to lowest enrollment rate of girls. The list feature also shows allows for choosing more than one indicator. For example, sorting the school first by their pupil-to-teacher ratio, but also showing the number of pupils and the number of teachers.

Caption: List showing number of schools and enrollment numbers by local government area in Sokoto state, Nigeria.
Using Reports
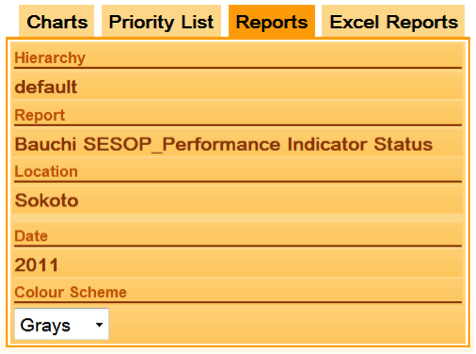
This function allows the user to make a single page report showing up to four charts or maps. For example, depicting Grade 3 promotion rates among girls from each school in a district.

NEXT STEPS
RTI is currently exploring how the EMIS Toolbox can become more mobile and used with other RTI-developed Information & Communication Technology tools, such as.
More information: www.emistoolbox.com

